 |
Mid-altitude wind measurements with mobile Rayleigh Doppler lidar incorporating system-level optical frequency control method
Abstract:
A mobile Rayleigh Doppler lidar based on double-edge technique is developed for mid-altitude wind observation. To reduce the systematic error, a system-level optical frequency control method is proposed and demonstrated. The emission of the seed laser at 1064 nm is used to synchronize the FPI in the optical frequency domain. A servo loop stabilizing the frequency of the seed laser is formed by measuring the absolute frequency of the second harmonic against an iodine absorption line. And, the third harmonic is used for Rayleigh lidar detection. The frequency stability is 1.6 MHz at 1064 nm over 2 minutes. A locking accuracy of 0.3 MHz at 1064 nm is realized. In comparison experiments, wind profiles from the lidar, radiosonde and European Center for Medium range Weather Forecast (ECMWF) analysis show good agreement from 8 km to 25 km. Wind observation over two months is carried out in Urumqi (42.1°N, 87.1°E), northwest of China, demonstrating the stability and robustness of the system. For the first time, quasi-zero wind layer and dynamic evolution of high-altitude tropospheric jet are observed based on Rayleigh Doppler lidar in Asia.

Fig. 1. Principle of the double-edge technique adopted in the Rayleigh Doppler wind lidar.

Fig. 2. Schematic diagram of the Rayleigh Doppler Lidar with system-level optical frequency control, and interior view of the compact receiver (inset, lower right corner).

Fig. 3. The NUIST Rayleigh Doppler lidar in experiment.

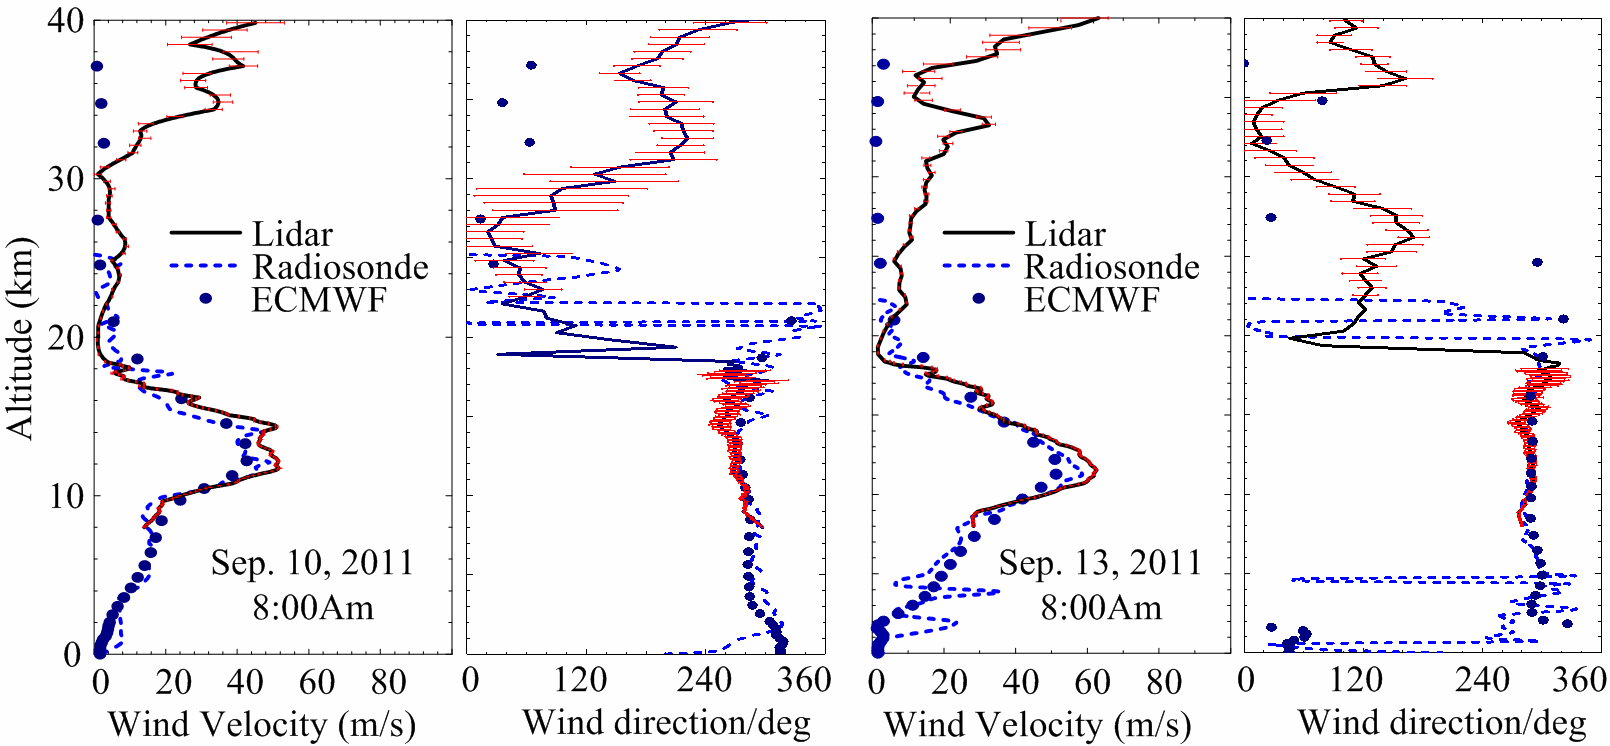
Fig. 4. Profiles of wind speed and direction measured by the Rayleigh Doppler lidar (solid line) compared with data measured by radiosonde (dashed line) and data from ECMWF (filled circle). In the altitude range where wind velocity is below the measurement error, wind direction from the lidar has no meaning, and its error bars are not plotted.

Fig. 5. Time-altitude plot of semi-continuous observation of mid-altitude wind field in September and October, 2011. Local midnights are tagged. Time scale is plotted in the lower left corner. The altitude of the tropopause is shown (dashed line with circles) for reference. The data with velocity error larger than 10 m/s are not plotted. The wind direction in the quasi-zero wind layer has no meaning, since the error of velocity measurement is larger than the wind velocity. The minimum velocity error and the minimum direction error in this experiment are estimated to be 0.86 m/s and 3.6°, respectively.
